- Redrock runs for about 35 minutes on a single timer, according to candidate reports: a Study (Investigation, Analysis, Report) followed by six short, independent Cases.
- Start from the objective and the questions, and save only the data they need. Much of what you read is there to distract you.
- Before any calculation, check three things: what the question asks, which data point you need, and the unit of measure.
- The maths is percentages, ratios, averages and growth. Check the input and unit before calculating; speed is useful only when the answer is accurate.
- Treat 23 minutes for the Study and 12 for the Cases as a starting point, and adjust it after your first timed runs.
Redrock Study is the first of the three McKinsey Solve games. If you want the overview of all three, including durations and official rules, start with the complete McKinsey Solve guide. This page goes deeper on Redrock only: what each stage asks, how to handle the data, and two fully worked practice exercises.
What Redrock asks you to do
McKinsey does not publish the length of each game; the invitation email gives the total. According to candidate reports, Redrock takes about 35 minutes and the same version appears in both the 85-minute and the 95-minute invitations. One timer covers the whole game, so time you spend on the Study is time you no longer have for the Cases.
The game has two parts. The Study is one research problem worked through in three stages, and the Cases are six short problems that do not depend on the Study or on each other. Movement is one way: candidates report that submitted answers cannot be changed and that the Study closes once the Cases begin.
- Investigation. You read an objective, a few paragraphs of text and one or more exhibits, and you drag the figures you think you will need into an on-screen research journal.
- Analysis. You answer a short series of calculation questions about the Study, typically three or four according to candidate reports, using a built-in calculator and the figures you saved.
- Report. You complete a written summary by filling blanks with your results, then choose a chart type and enter the values that build the chart.
- Cases. Six short problems, each with its own text or table and one or two questions. Candidates report about two minutes per case.
The Report is the stage that surprises people on a first run. Filling the sentence is quick if your Analysis answers are right, but you also have to pick the chart that fits the request and enter its values in the right order.
The screenshots above come from our practice simulator, which is built on candidate reports of the real format. The real interface may differ in detail, and McKinsey changes the games over time, so read your own invitation and the untimed tutorial carefully on the day.
Three checks before any calculation
The calculations in Redrock are rarely hard. Most are a percentage, a ratio, an average or a growth rate. What costs points is calculating confidently with the wrong number, or giving the right number in the wrong unit. A short routine before each calculation prevents both.
1. What does the question ask?
Read the last line of the question first. Is it a percentage change, a difference in percentage points, a total, an average per unit? Write the shape of the answer before you look for data.
2. Which data point do I need?
Name the exact figure, including its year, group and source. "Bee visits on meadow verges in Year 3" is useful; "the bee number" is how you pick the wrong row.
3. Which unit?
Check what the answer field expects: per year or per season, per hectare or in total, US$ or thousands of US$, per cent or percentage points. Convert before you type.
Practise these checks until they become a quick, reliable routine under time pressure.
Collect the right data and skip the rest
In Investigation you do not yet know the exact questions, but you do know the objective. Read it first and ask what an answer to it would need: usually a change over time, a comparison between groups, and a cost or quantity. Save the figures that feed those, with a clear label, and leave the rest.
A good part of the study text exists to look relevant without being needed. Typical distractors are totals when the question is about a subset, figures from a neighbouring place or a different year, survey or sample sizes, and facts that explain how a number was produced rather than the number itself.
Rename journal entries as you save them ("meadow, Y1, visits/hr"). A list of bare numbers forces you to reread the text in Analysis, which is exactly the time you were trying to save.
Saving too little is also a mistake. The Report chart often needs every point of a series, not only the two you used in a percentage change. If the objective talks about a trend, save the whole series.
Worked example 1: from study text to report chart
The exercise below follows the shape of a Redrock Study at a smaller scale. Read the material once, decide what you would save, and try each question yourself before you read its solution.
The study material
Objective. Assess whether converting roadside verges to wildflower meadows has helped bees in Linnet Valley, and what the change saves the council each year.
- In Year 1 the council mowed all 160 hectares of its roadside verges, four times a year.
- At the start of Year 2 it stopped mowing 40 of those hectares and sowed them as wildflower meadow. The rest stayed mown.
- Maintaining a mown hectare costs US$320 a year. A meadow hectare costs US$180 a year, for one late cut and seed top-ups.
- Volunteers counted bees on 12 survey plots, six on each verge type. Results are in Exhibit 1.
- In a survey of the valley's 2,300 households, 64% of respondents said they liked the meadows.
Exhibit 1. Survey results (averages across plots)
| Measure | Year 1 | Year 2 | Year 3 |
|---|---|---|---|
| Bee visits per hour, meadow | 40 | 49 | 58 |
| Bee visits per hour, mown | 40 | 41 | 42 |
| Butterflies per hour, meadow | 12 | 15 | 21 |
| Survey hours logged | 310 | 350 | 420 |
Step 1. Decide what to save
The objective asks about bees and about annual savings, so the useful figures are the bee visits on both verge types, the area converted and the two annual costs. The butterflies, the survey hours, the 160 hectares, the four mowings and the household survey are all distractors.
Typical error: saving every number "just in case", then hunting through a long journal in Analysis. The opposite error is saving only Years 1 and 3 and having to reread the exhibit for Year 2 when the chart asks for it.
Step 2. Question 1
By what percentage did bee visits per survey hour on meadow verges change between Year 1 and Year 3?
The question asks for a percentage change, so you need a start value and an end value for the same series. Both are bee visits per hour on meadow verges.
Change = 58 - 40 = 18 visits per hour
Percentage change = 18 / 40 = 0.45 = +45%
Typical error: dividing by the end value (18 / 58 = 31%) or using Year 2 as the end point. A percentage change always divides by the starting value.
Step 3. Question 2
By how many percentage points did the increase on meadow verges exceed the increase on mown verges over the same period?
The answer is a difference in percentage points, so you first need the percentage change on mown verges, then subtract.
Mown verges: (42 - 40) / 40 = 2 / 40 = 5%
Difference = 45% - 5% = 40 percentage points
Typical error: answering 45 because you reused Question 1, or calculating 58 / 42 and reporting a ratio. The words "percentage points" tell you the unit before you start.
Step 4. Question 3
How much does the council save each year, in US$, on the hectares converted to meadow?
The question asks for an annual total across the converted area. The costs are already per hectare per year, and the converted area is 40 hectares.
Saving per hectare = 320 - 180 = US$140 a year
Total saving = 140 x 40 = US$5,600 a year
Typical error: multiplying by 160 hectares (US$22,400), which is the whole network rather than the converted part. A second trap is multiplying by the four mowings a year, although the cost is already annual. This is where the unit check pays off.
Step 5. Fill the report sentence
"Between Year 1 and Year 3, bee visits per survey hour rose by [ ]% on meadow verges, [ ] percentage points more than on mown verges. Converting [ ] hectares saves the council US$[ ] a year."
The answers in order are 45, 40, 40 and 5,600. Two blanks read "40" for different reasons, so check each blank against its label rather than copying the last number you calculated.
Step 6. Choose and fill the chart
Show how bee visits per survey hour changed from Year 1 to Year 3 on both verge types.
The request is a trend over time for two series in the same unit, which makes a line chart the natural choice. A pie chart would be wrong because the values are not parts of one whole. The values to enter are the six raw figures, three per series and in year order.
Typical error: entering the percentage changes (45 and 5) instead of the raw values, or adding the butterfly series because it sits in the same exhibit. Re-read the request: it names one measure and two groups.
What to collect and what to skip in this example
| Data point | Save it? | Why |
|---|---|---|
| Bee visits, both types, Years 1 to 3 | Yes | Questions 1 and 2 and the chart |
| 40 hectares converted | Yes | Question 3 and the report |
| US$320 and US$180 per hectare a year | Yes | Question 3 |
| 160 hectares in total | No | No question is about the whole network |
| Four mowings a year | No | The cost is already annual |
| Butterflies, survey hours, 12 plots | No | Not part of the objective |
| 2,300 households, 64% approval | No | Opinion data, not asked |
In this example, three of the seven groups of figures are needed. Use the objective to decide what to save rather than assuming that every number will be useful.
Worked example 2: a short Case
The Cases are self-contained: everything you need is in the case itself, and nothing carries over from the Study. Each is short, so the main risk is reading too fast and answering a slightly different question from the one asked.
The case
A nature trail through the meadows recorded 3,300 visitors this season, which is 10% more than last season. The trail is open for a six-month season. The rangers plan one hour of patrol for every 150 visitors.
Question A
How many visitors did the trail have last season?
This season is last season plus 10%, so this season equals 110% of last season. You need to go backwards from the larger number.
Last season = 3,300 / 1.10 = 3,000 visitors
Typical error: taking 10% off this season (3,300 x 0.9 = 2,970). The 10% was calculated on last season's number, not this one. Check it by going forwards: 3,000 x 1.1 = 3,300.
Question B
If next season brings 3,600 visitors, how many ranger hours per month will the trail need?
The unit in the question is hours per month, not hours per season. Find the season total first, then divide by the six months.
Hours per season = 3,600 / 150 = 24 hours
Hours per month = 24 / 6 = 4 hours
Typical error: typing 24, which is correct for the season and wrong for the question. The calculation was right; the unit check was skipped.
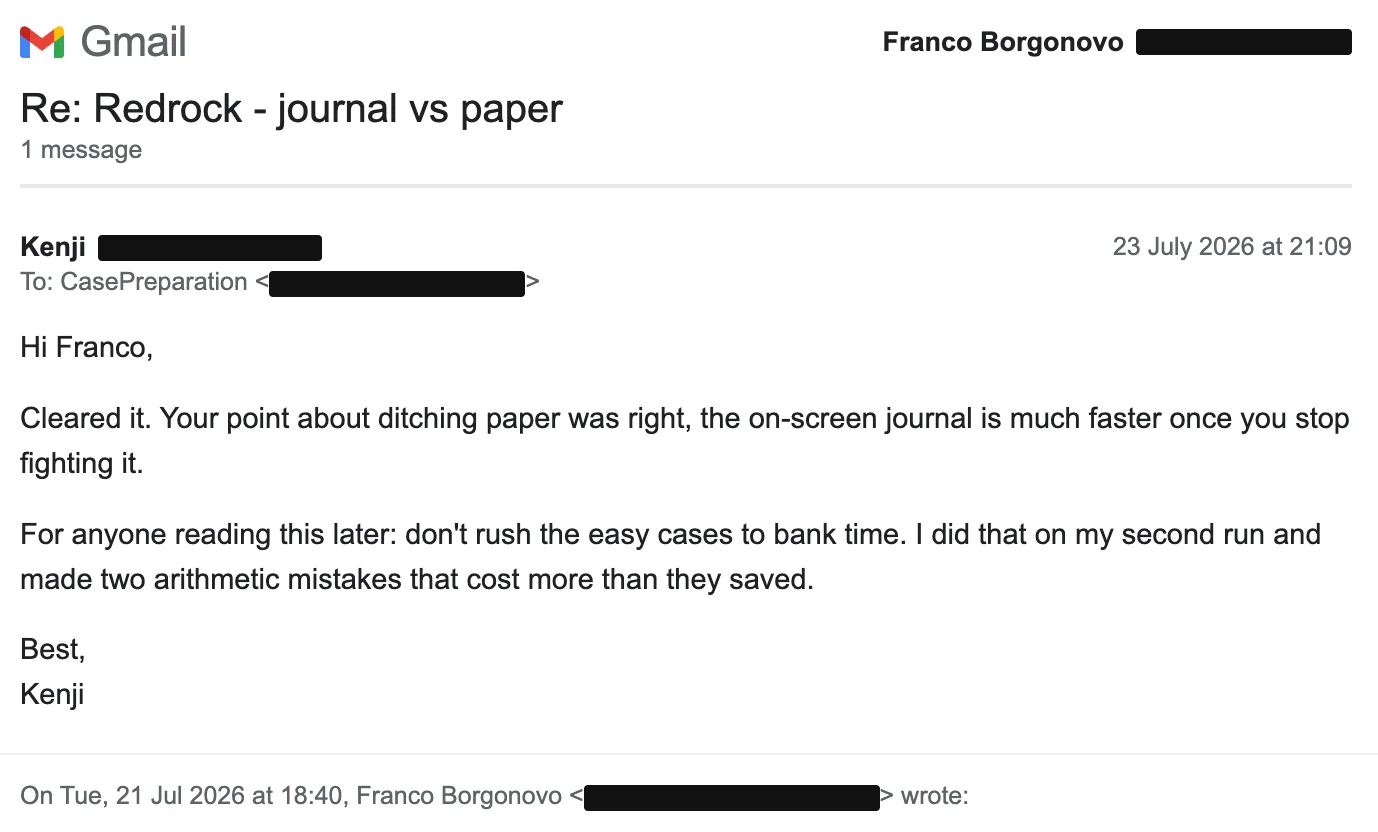
Kenji, after clearing McKinsey Solve: the on-screen journal became faster once he stopped fighting it, and rushing the easy cases to bank time cost him two arithmetic mistakes.
Kenji's second point applies to every Case. Easy cases are where you collect secure points, so give them the same three checks as the hard ones rather than trying to save seconds on them.
Pacing: a starting point for 35 minutes
Candidates commonly report spending about 23 minutes on the Study and 12 on the six Cases. Treat this as a reference to start from, not a rule. After your first two or three timed runs you will know whether you are faster at reading or at calculating, and you can move a minute or two where you need it.
| Stage | Starting point | What usually eats time |
|---|---|---|
| Investigation | About 5 min | Saving every number, rereading the text |
| Analysis | About 12 to 13 min | Recalculating after picking the wrong row |
| Report | About 5 min | Retyping figures, hesitating on the chart |
| Six Cases | About 12 min, 2 per case | Getting stuck on one case |
Split reported by candidates and in public preparation guides, which vary slightly; some give the Cases closer to 15 minutes. It is not an official McKinsey figure.
If you get stuck, enter the best answer you can support and move on. Protect time for the remaining Cases rather than spending several minutes on one question.
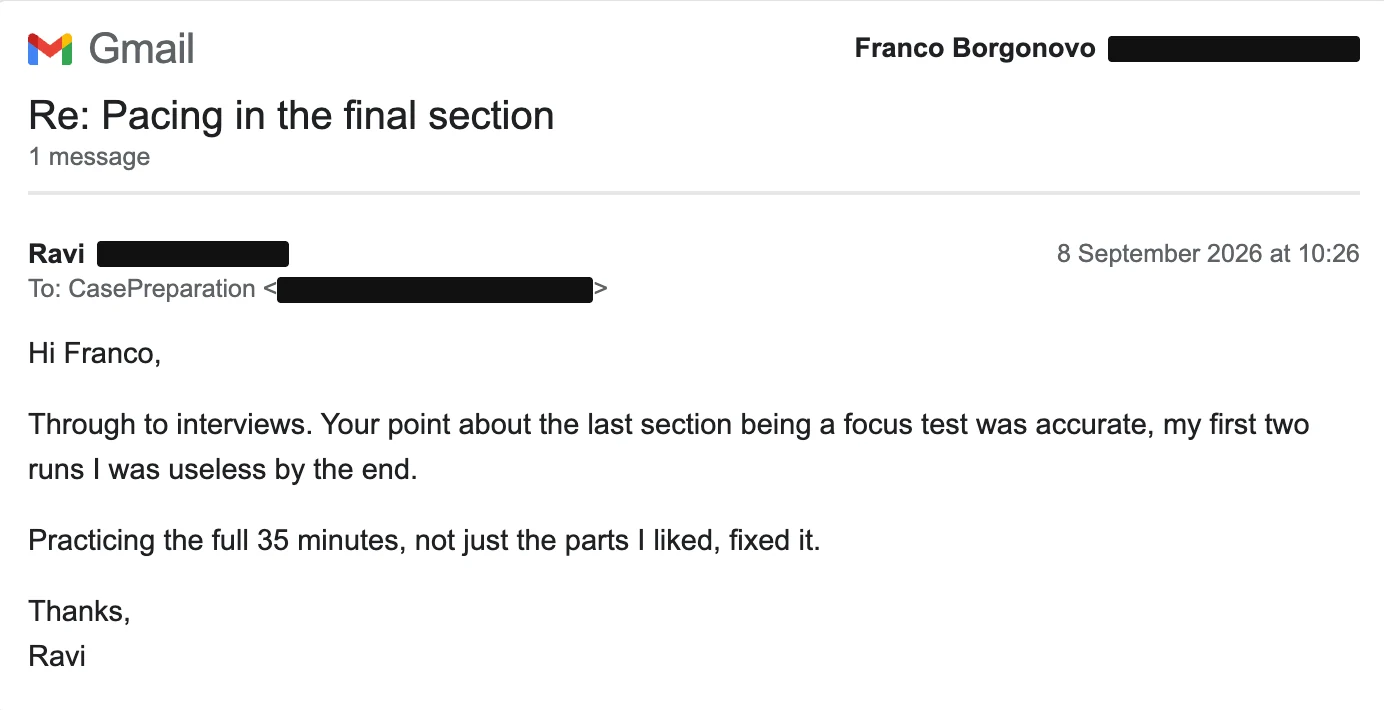
Ravi, through to interviews: by the end of his first two runs he had lost focus, and practising the full 35 minutes, not just the parts he liked, fixed it.
Practising individual questions develops your calculation skills. Full timed runs also show how well you maintain focus in the Cases after working through the Study.
What a detailed report adds to your practice
Playing a scenario shows you the format and where the clock gets tight. It does not always show why you lost points, because a wrong answer can come from a wrong input, a wrong formula or a wrong unit. That diagnosis is what decides what you practise next.
The detailed report in the CasePreparation simulator gives you, for each part of the run:
- your score by part (Analysis, Report and Cases), so you can see where the points went;
- each of your answers next to the correct one, with the solution written out step by step;
- a check of your research journal: how many figures you saved, how many were needed, which ones you saved and never used, and which ones you needed but missed.
The journal check turns "I collect too much" or "I keep missing a number" from a feeling into a count you can bring down on the next run.
McKinsey Solve · full access
Practise Redrock with a report after every run
The free scenario, Ardloch Fishway, is a complete timed Redrock run that you can replay as often as you like, but it has no detailed report. Full access adds the scenarios and the feedback you need to improve between runs.
- 15 Redrock Study scenarios, plus Sea Wolf and Sustainable Futures Lab
- Detailed report and PDF after every run
- 12 months of access, US$149, one payment
Money-back guarantee if you do not pass McKinsey Solve, subject to conditions. CasePreparation is independent and not affiliated with McKinsey & Company.
A practice routine for Redrock
A few runs that you review carefully teach more than many runs played without a review. A simple cycle works well.
- Play one full timed run without stopping, so you see your real pace across the Study and the Cases.
- Find where you lost points or time. Separate input errors (wrong figure), method errors (wrong formula) and unit errors (right number, wrong form).
- Drill only that weakness for a short session: the three checks on each question, labelled journal entries, or two-minute cases against a timer.
- Play a new scenario and compare. The same weakness should show up less; if it does not, change the drill rather than adding more runs.
Redrock is followed by Sea Wolf, a constraints problem with a different rhythm; the Sea Wolf guide works through one site by hand. The Sustainable Futures Lab guide covers the third game, which is about judgement rather than calculation.
Can I use a calculator in Redrock?
Candidate reports describe a calculator built into the Redrock interface. McKinsey's official FAQ forbids other applications, websites, AI tools and prepared notes during the assessment, so plan to use only what the game provides.
Is Redrock different in the 85-minute and 95-minute versions?
According to candidate reports, no. The two versions differ only in the Sustainable Futures Lab; Redrock and Sea Wolf are reported as identical in both.
What if I run out of time in the Study?
Because one timer covers the whole game, extra minutes in the Study come out of the Cases. If the Report is taking too long, finish it with your best answers and move on, so you leave time to attempt the six Cases.
Where to start
The quickest way to learn the format is to play it once under time. Try the free Ardloch Fishway scenario, then apply the three checks and the pacing table above on your next run.
McKinsey Solve · free practice
Try Redrock free, under real time pressure
One complete timed scenario for each of the three games, replayable, with no card needed.

About Franco
Franco Borgonovo
Former BCG Principal · 10-year tenure · Official BCG coachFranco spent ten years at BCG, from intern to Principal, interviewing and selecting candidates as a global lead recruiter. He is still an official BCG coach for new hires, and today works one to one with candidates on applications, McKinsey Solve and interviews.
More about Franco →- McKinsey Solve FAQ (August 2025) · official rules: untimed tutorials, no applications, websites, AI tools or prepared notes